The start page of the app is packed with information. Here is a short explanation of all its features. First, all the widgets at the start page are moveable – just tap and hold on to a widget, and all the boxes will start wiggling. Drag and drop them in the order you prefer, and tap the checkmark in the upper right corner when you’re happy with the refurbishment of your app.
Access Your Profile, Training Log, and Body Measurement
To access your profile, just tap the picture in the upper left corner. In this article, you can read more about your profile.
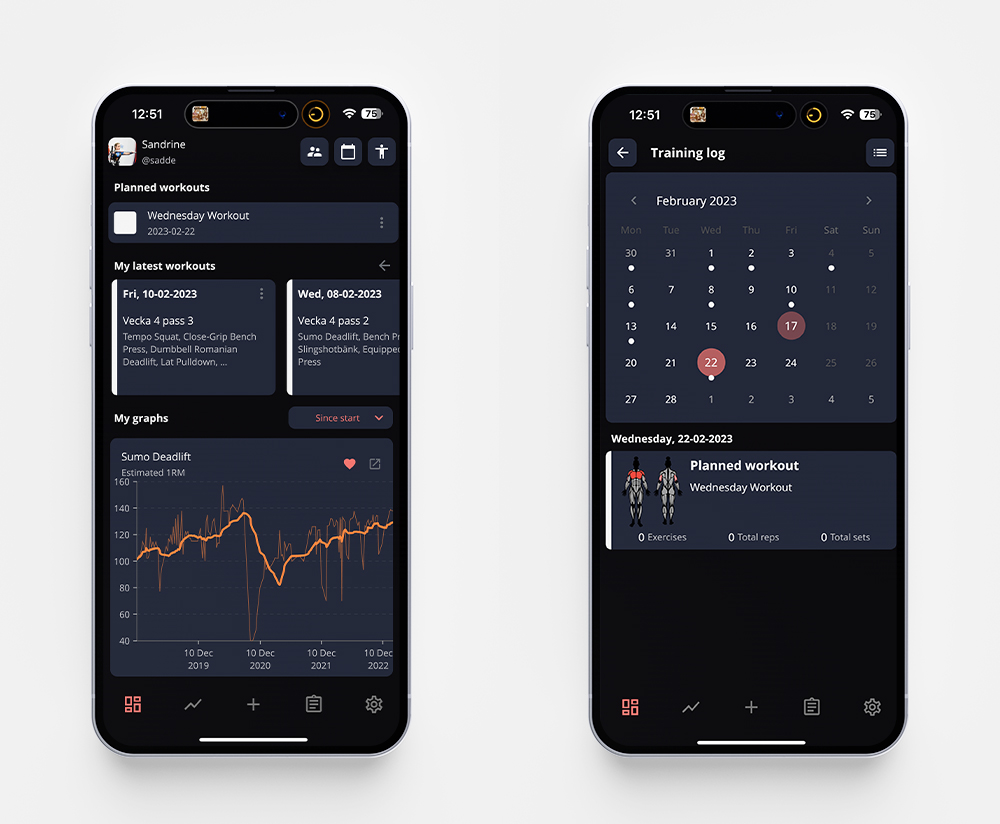
The small calendar icon is a shortcut to your training log. To read more about your training log, and what you can use it for, read this article.
Next to the calendar, you’ll find an icon of a person. Tap it to go to the body measurement page. More about the different kinds of body measurements here.
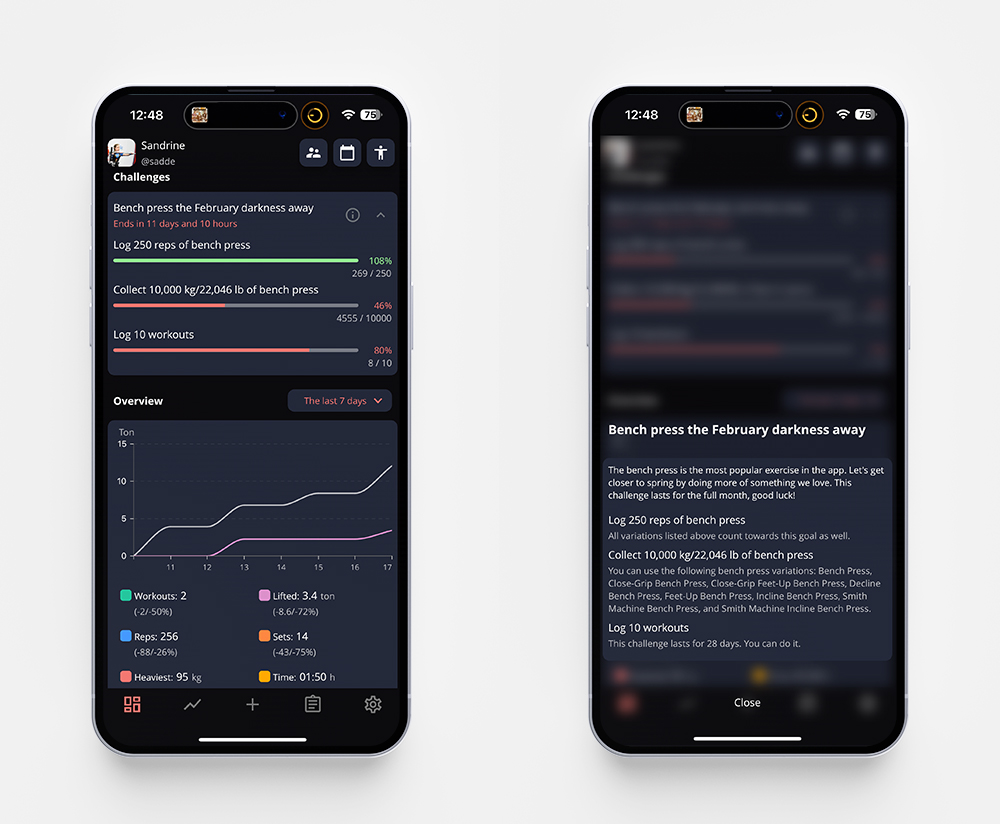
Challenges
Every once in a while, a new challenge will appear on your home screen. Tap the info icon to read more about the challenge, and the arrow to extend/minimize the progress bars. Read more about the challenges here.
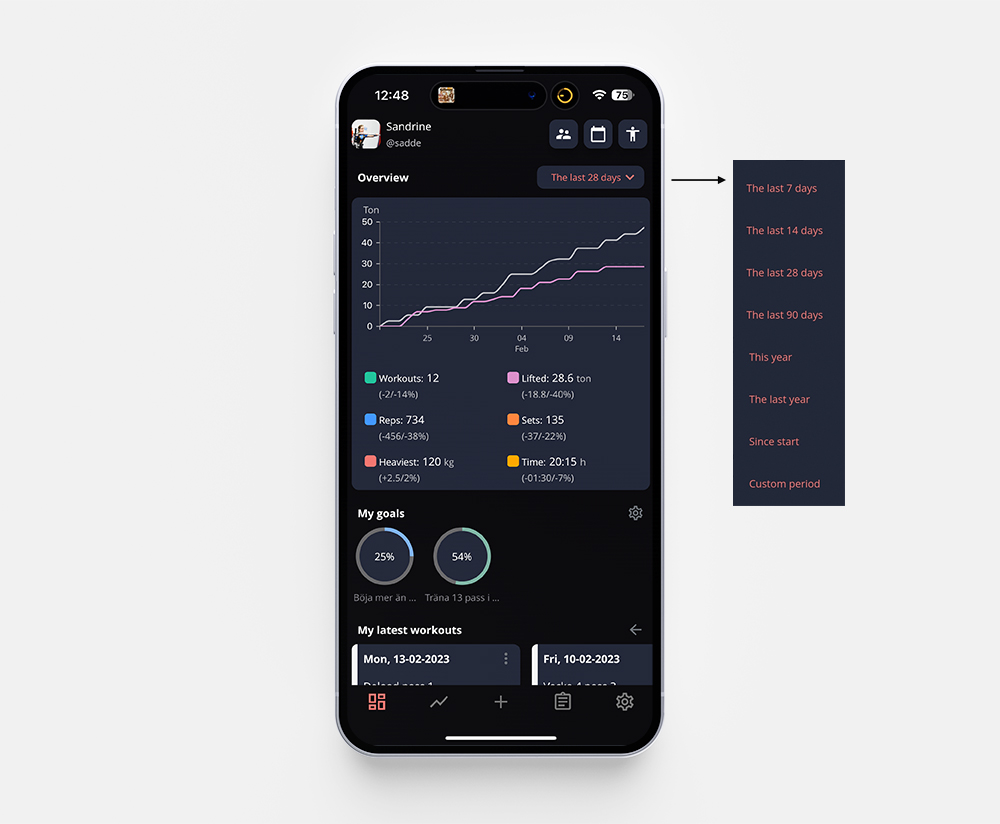
The Quick Stats
In the Overview widget, you can track your training progress with a few variables we’ve chosen for you. Tap the red text to change the time span of your overview. In the example below, I’ve chosen to see how much I’ve lifted in total in the last 28 days. The pink line shows the last 28 days in the graph, and the grey line is the 28 days before that. (ie the grey line is always the same amount of time, the period just before the last)
If you want to see the graph for any other variable, just tap that one, and the graph will change. The color will always be the same as the variable, so it’s easy for you to know which one you’re looking at.
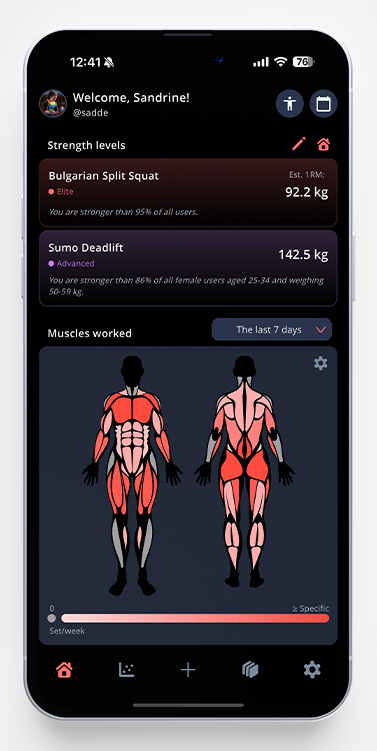
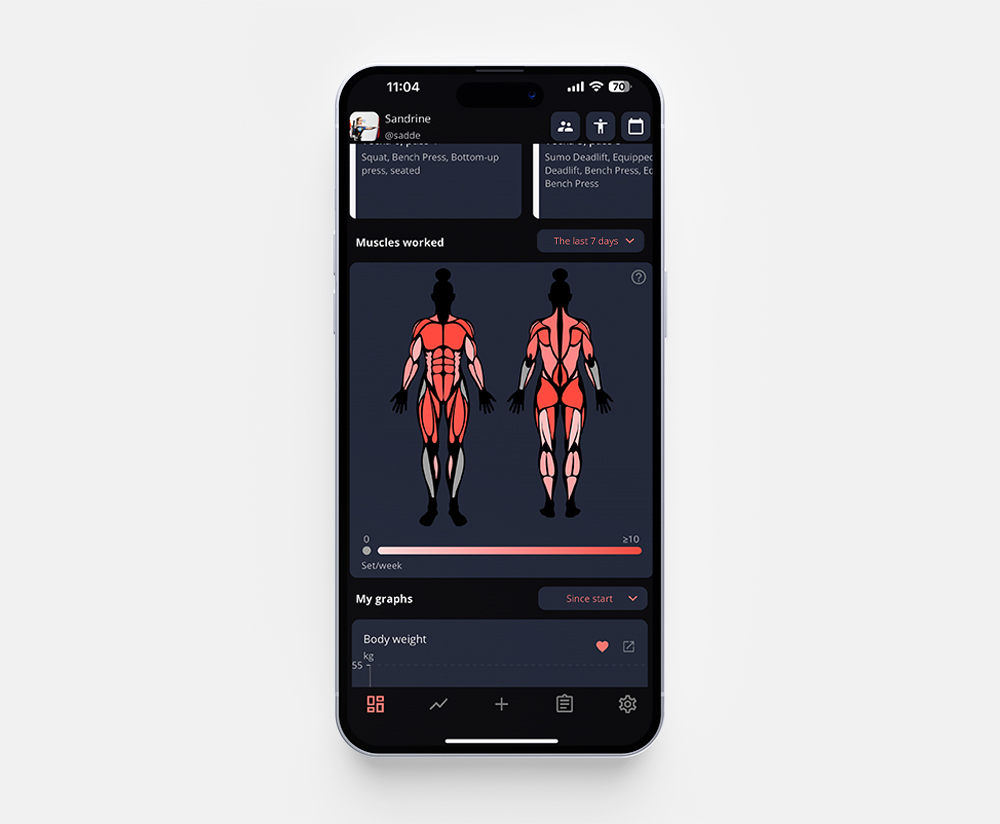
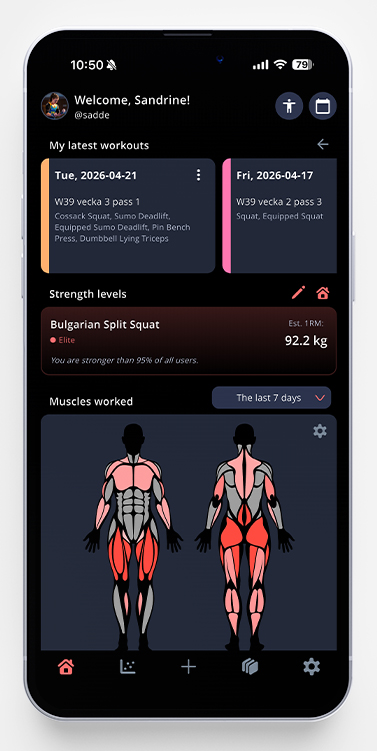
Muscles Worked
If you are a premium user, you can see how well you’ve trained your muscles with this widget. It’s a visual overview of how many sets you’ve done per muscle/week. You can read more about it in this article.
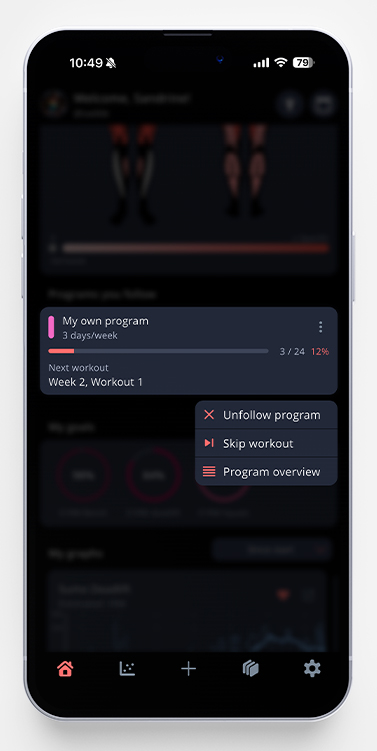
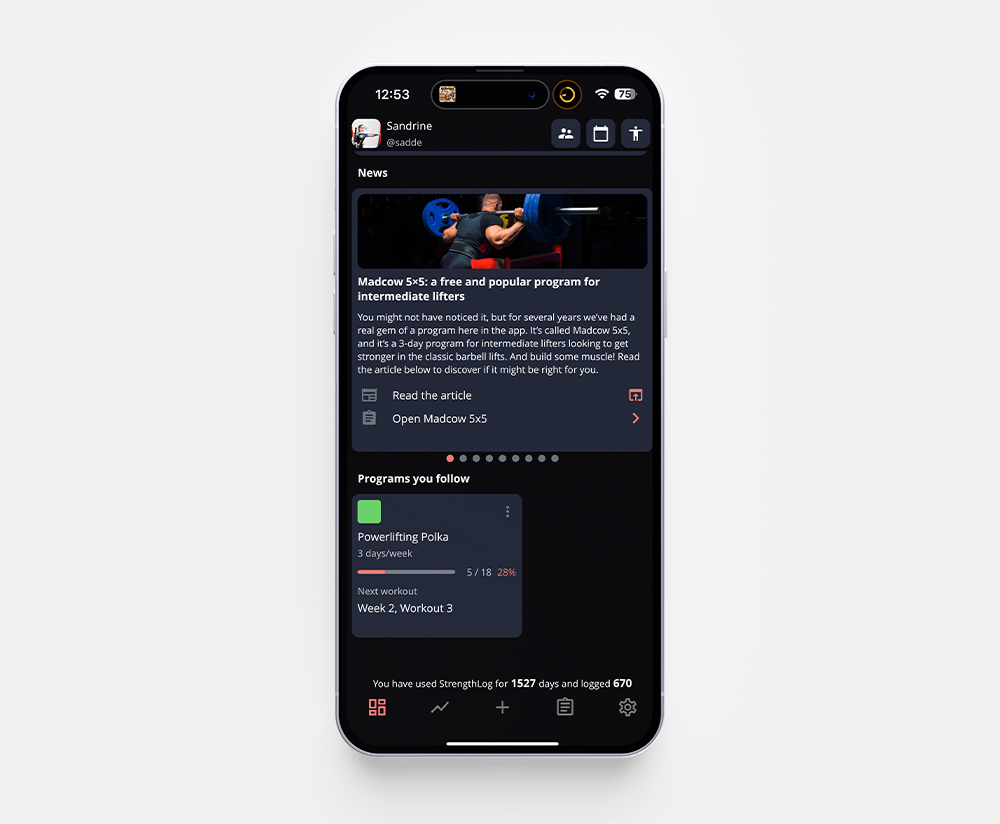
Programs You Follow
If you’re following any of our programs, you will see a widget of them in the app as well. A progress bar will tell you how far in you are in the program, and which workout that’s next. By tapping the box, you’ll get a preview of the workout, and you can easily start it from there. If you tap the three dots in the right corner of the widget, you are also able to either skip a workout or unfollow the program.
My Latest Workouts
The widget called My latest workouts is a summary of your last saved workouts. You can scroll through the last 10 workouts, and after those, there is (another) shortcut to your training log. If you want to go back to the beginning of the list, just tap the arrow in the upper right corner of the widget.
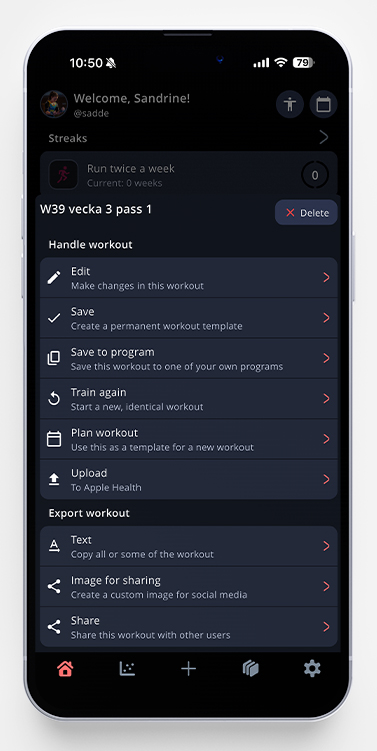
If you tap the three dots of a workout, you’ll see the pop-up to the right in the picture below. From here, you’re able to edit, train again, plan a new workout based on the old one, etc.
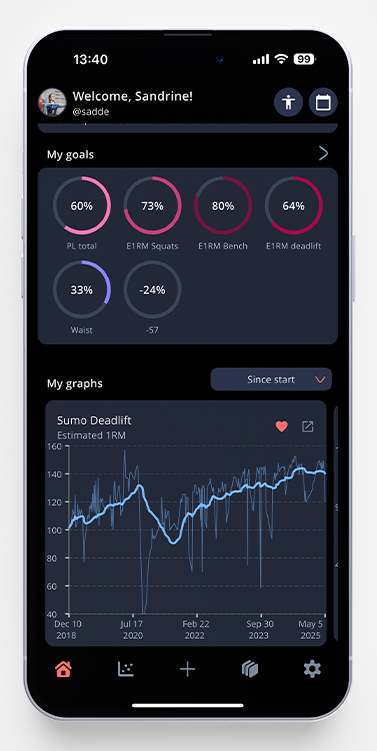
My Goals
By tapping the circle of a goal, you’ll get a pop-up with a graph of your real-time progress of said goal. To read more on how to create new goals, and edit your current ones, read this article.
Planned Workouts
If you are the kind of person that likes to plan your workouts ahead – we have a widget for that too! When you have one (or more) planned workouts, they will show up in a widget on your start page. You can start the workout by tapping it, and then, from the preview, click on Start workout. You are also able to see the planned workout in the calendar view, that you find by tapping the calendar icon in the upper right corner of your home screen.
My Graphs
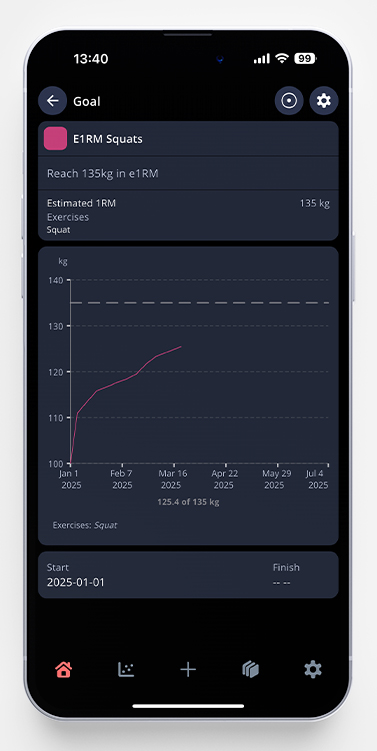
You have the opportunity to add different graphs to your home screen as well. In the example below, you can see that I’ve added a graph over my estimated 1RM in equipped bench press. If you’ve added more than one, you just swipe to scroll between them.
To add a new graph, go to the statistics page of the app. In this example, I would like to add a graph for my estimated 1RM in bench press. I go to Exercises and pick Bench press. From there, I tap Graphs and choose Estimated 1RM. Then I will see the graph displayed on the picture to the right below. Tap the heart icon, and the graph will be added to your home screen.
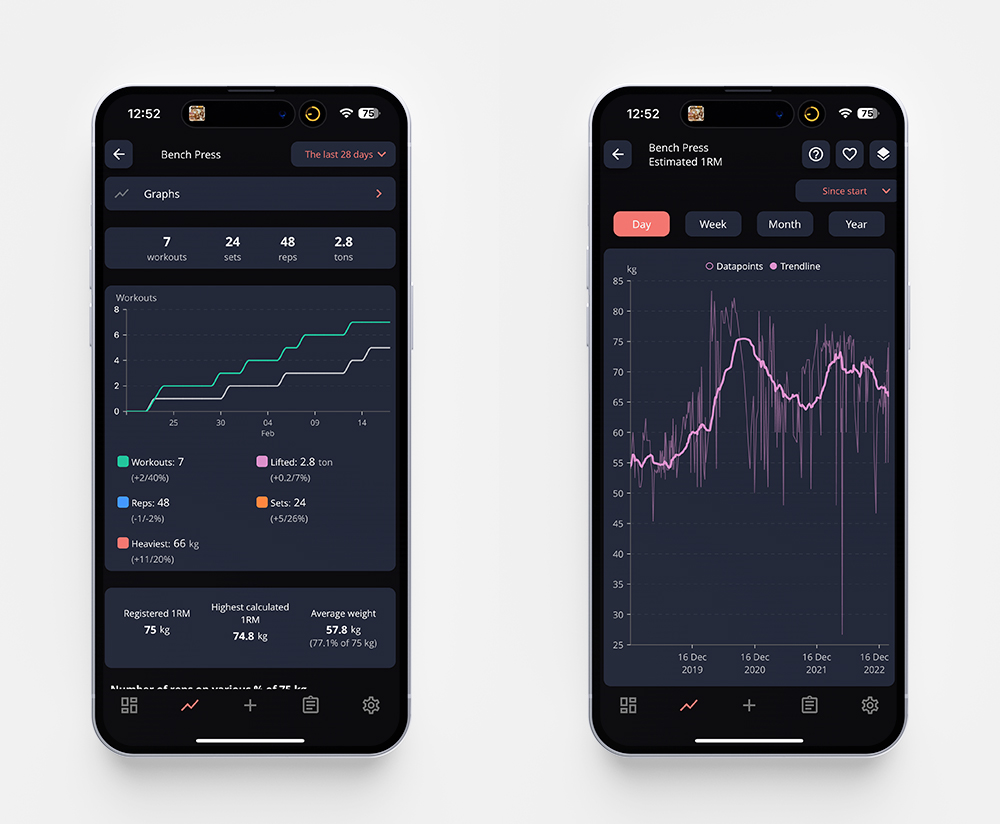
If you want to delete a graph from your home screen – just tap the heart icon in the upper right corner of that graph, either on the home screen or from the statistics page – and it will be removed.
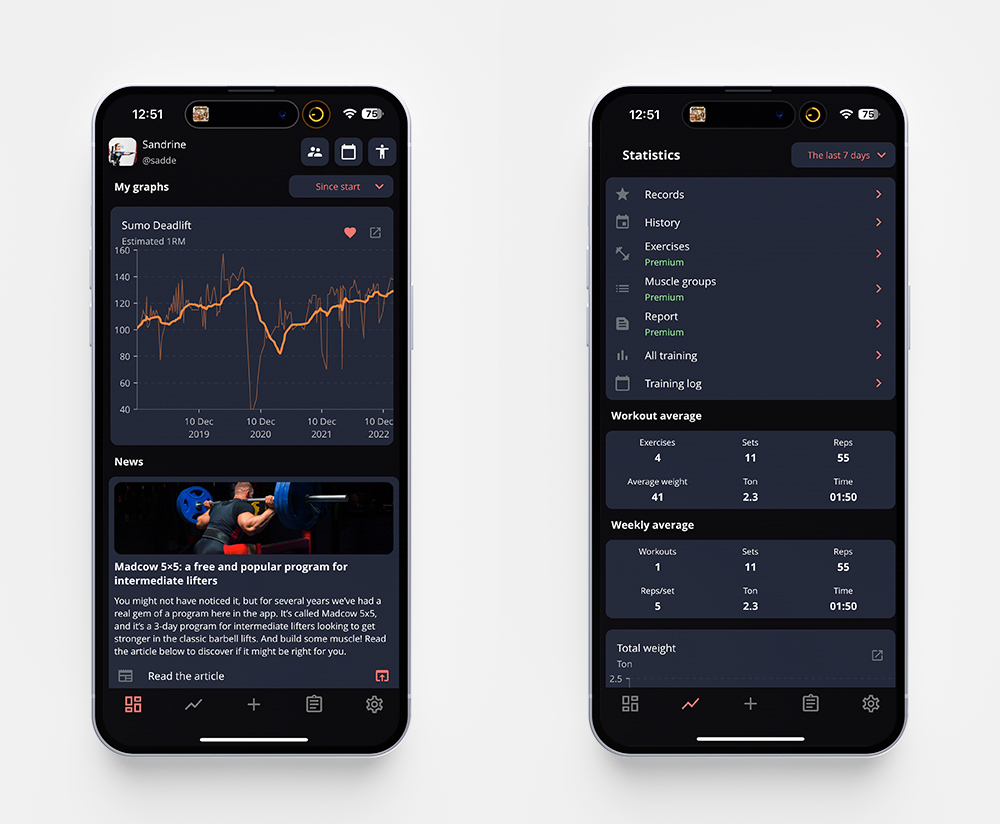
News
Whenever we add a new big feature in the app, or add a new program to our program bank, you’ll find that info here! Some articles are available to read directly in the app, and some will direct you to our website.
Strength Levels
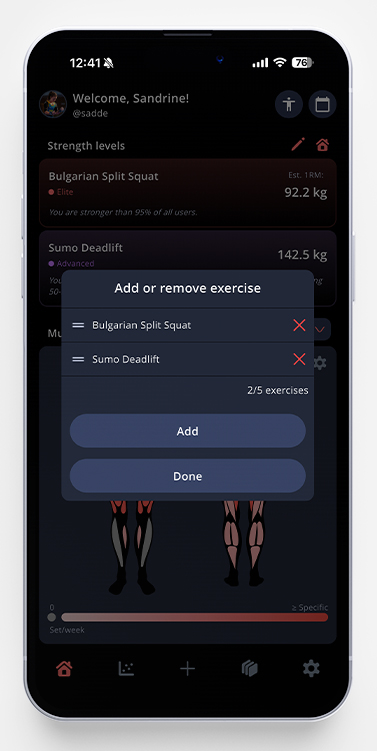
It is possible to pin your 5 favourite strength levels on your home screen. Tap the small plus sign to the right to add your first exercise. You can choose if you want to see your strength level compared with all, or if you want to narrow it down by filter on your sex, weight group and age span.
Once you’ve saved one exercise, you’ll add more by tapping the small pen icon. If you tap the small house icon, you’ll go directly to the main strength level page.
You can read more in-depth about Strength Levels in this article.